Adobe Analytics vs Tableau
Organizations try to find innovative technologies that can offer them an advantageous edge in decision-making. Adobe Analytics and Tableau are two market leaders in this field; however, each of them offers specific features and performance benefits. Adobe Marketing Cloud’s tool called Adobe Analytics is mainly concerned with Website Analytics. While Tableau, which became a Salesforce. com subsidiary specializes in data visualization and business analysis. This blog compares Adobe Analytics and Tableau in terms of features, user cases, performance, and pricing to assist organizations in determining which tool is ideal for them. You can also take a complete Adobe Analytics course to learn more about this topic.
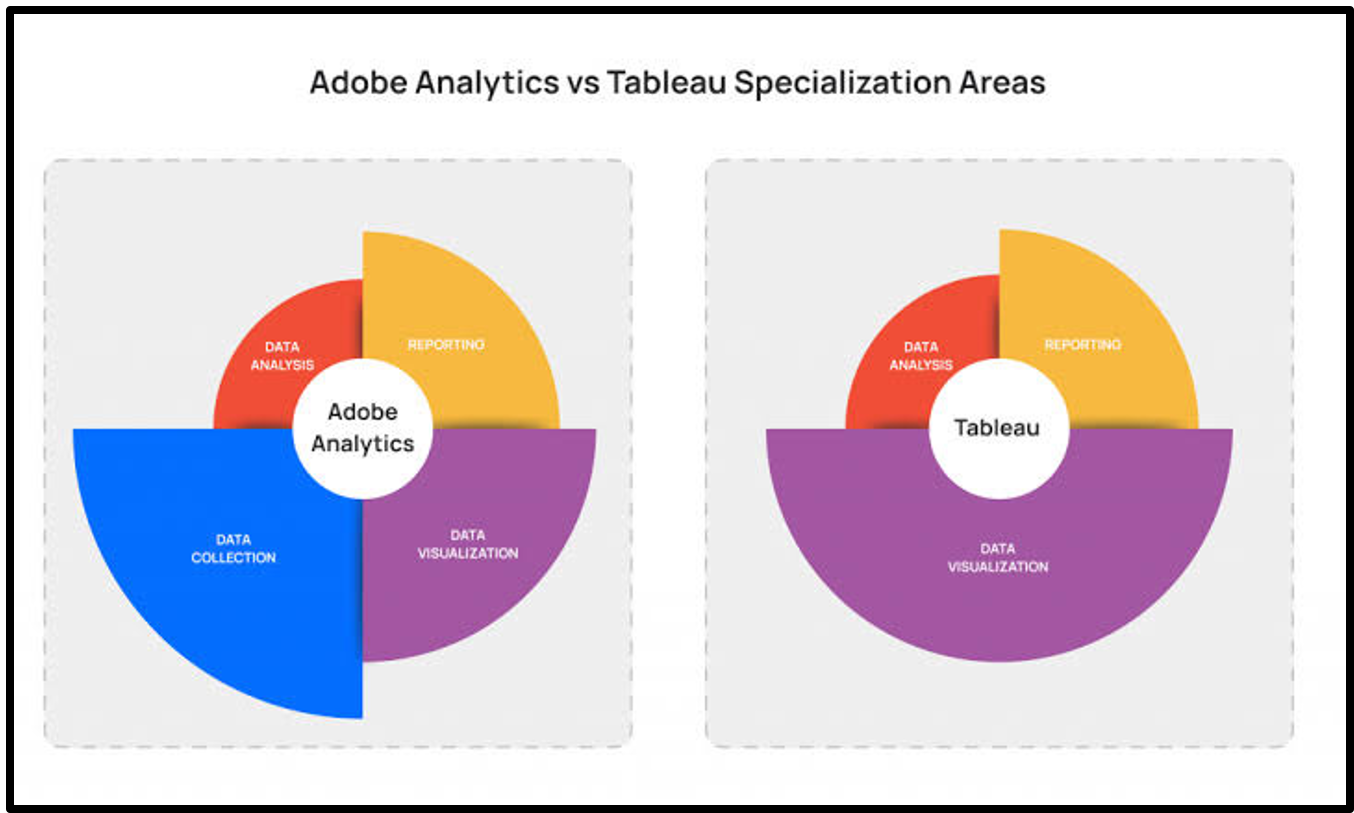
Core Features
Adobe Analytics
Adobe Analytics holds the capability to be a strong full-fledged real-time web analytics and profound customer analysis tool. It enables companies to monitor customer engagement from every possible touch point and gain valuable insights about the users. The key features of Adobe Analytics include:
1.Data Collection:
Compared to other analytical tools, Adobe Analytics is most beneficial in accumulating relatively big data from websites, mobile applications and other digital encounters. That is why it has a tag-based system of tracking to make modifications and detect specific events and interactions.
2.Segmentation:
The platform also has strong targeting features that allow users to set up highly refined segments based on the specified parameters, including age, interests other related factors, and activity level. This makes it easier and possible to get to a more differential level of analysis and associated marketing strategies.
3.Real-Time Reporting:
Using Adobe Analytics, companies can create real-time reports, which is one of the primary benefits of the tool. Businesses can make decisions that are current with the trends and any activity of the users that is being observed online.
Tableau
Tableau, as we know it, is famous for its ability to produce powerful data visualization and business intelligence. This enables the users to join data, visualize it, and share it in an engaging and easy-to-understand manner. Key features of Tableau include:
1.Data Connectivity:
Tableau is compatible with several databases, both online and local spreadsheets and services, and cloud and big data platforms. This characteristic guarantees the ability of users to connect to almost every data source without complicated ETL processes.
2.Visual Analytics:
Tableau is a program that is best suited to the visual analytics aspect. The software allows users to build extended conceptions of dashboards, reports, and visualizations with the help of a graphic interface and drag-drop. The application of charts is diverse, and the possibility of choosing an individual design of the charts is also great.
3.Interactive Dashboards:
Tableau allows its clients to develop a series of dashboards that can be best used to interact with the organization's members. This means the audience can zoom in and out to fine details of data manipulate filters, and touch the graphic images.
4.Advanced Analytics:
Tableau also has features that allow it to perform further analysis of trends and create models using statistical data and forecasting tools. Connecting with R and carrying out Python script analysis for improved capabilities is also possible.
5.Collaboration and Sharing:
Tableau enables users to co-author by Tableau Server and Tableau Online, where the users share their dashboards and reports with end-users. This also helps in the timely sharing of information on decision-making to various departments in the organization.
Related Article - Tableau Tutorial
Use Cases
Adobe Analytics
1. E-Commerce Optimization:
Adobe Analytics is implemented widely in e-commerce companies for analyzing customers’ actions, cart abandonment ratios, and conversion paths. Thus, it helps businesses to understand the prospects of their Internet sales, to work on their Internet site and adjust their marketing strategies for increasing clients’ satisfaction.
2. Personalized Marketing:
Adobe Analytics also provides smart segmentation and insight for carrying meaningful messages to different customers that facilitate calling the right segment of customers. This increases the levels of participation and the conversion frequency as well.
3. Customer Journey Analysis:
Adobe Analytics addresses the problem by delivering a full cross-screen analysis in regards to the customer experience, starting from the initial contact and up to the moment of purchase. This assists businesses in managing all the factors that shape the customers’ choices to maximize the results they want.
4. Real-Time Campaign Tracking:
Adobe Analytics also enables marketers to ‘listen in’ to their campaigns as they run in real-time. This lets them adapt effectively to using their available resources for marketing, hence the need to establish their current status.
Tableau
1. Business Intelligence:
Tableau is currently used in business intelligence in many organizations from different fields. It facilitates representing and analyzing the collected data and can contribute to business decision-making.
2. Financial Analysis:
Finance specialists and analysts employ Tableau to prepare or generate elaborate financial reports and quick visual reviews. This includes revenue analysis, expense tracking and financial forecasting.
3. Healthcare Analytics:
In the healthcare field, Tableau is applied to work with patient information, control healthcare results, as well as to manage resources. This, in turn, assists in enhancing the standards of patient care and increasing organizational productivity.
4. Sales Performance Tracking:
Tableau is used by sales teams to monitor the results, analyze the data, and explore ways to improve sales. The mobility of the platform is complemented by the use of interactive dashboards to navigate through the data and discover relationships.
Performance and Scalability
Adobe Analytics
Adobe Analytics aims to process massive amounts of data and report on the issue shortly. Scalability and reliability are achieved through the cloud-based architecture hence enabling organizations to deal with and analyze big data. Nevertheless, the performance can be affected by the volume of data, the complexity of queries and the performance of the data collection solutions.
1.Scalability:
Adobe Analytics can be adapted to cater for large corporations and organizations because it can computationally handle a large amount of data coming from various sources. It has also designed its architecture to support horizontal scaling so that the performance does not begin to suffer as the volume of data increases.
2.Performance Optimization:
Adobe offers several techniques, features, Checklists, and recommendations to make Adobe Analytics implementations work efficiently. This refers to the proper utilization of tags, data sampling methods, and calculated values.
Tableau
Tableau is notably characterized by efficient data management as well as data analysis and visualization ability. More so, the platform takes advantage of memory processing and live query capability to provide fast analysis results.
1.In-Memory Processing:
Tableau has a data processing engine called Hyper, which enables users to run large amounts of data quickly. It enables quick analyses and straightforward investigation of data in real time; therefore, it is ideal for interactive purposes.
2.Live Connections:
Tableau can point to real data sources, which lets the information change dynamically and thereby eliminates the need to pull data. This ensures that, in the future, users will be able to view the most updated information possible.
3.Scalability:
Tableau Server and Tableau Online are forms of organizations’ Tableau deployment solutions. They allow high concurrency, which enables users to get into the application and manipulate dashboards without interference from others.
Pricing and Licensing
Adobe Analytics
Adobe Analytics has a basic and premium pricing structure that depends on the amount of data that has to be analyzed as well as the features and additional services required for analysis. Pricing can be quite involved because, usually, it involves various parts of the Adobe Experience Cloud. Adobe customarily offers product quotes based on the client’s requirements and typically may not have a fixed price for each of its products.
Enterprise Focused:
Adobe Analytics is aimed mainly at large business enterprises that have large budgets for analytics and marketing tools. It should be noted that the broader range of features and integration options make these solutions more costly yet reasonable for such organizations.
Tableau
Tableau, on the other hand, has a bit flexible price model depending on the type of deployment and the needs of the user. This part provides the pricing for Tableau Desktop, Tableau Server, Tableau Online, and Tableau Public.
1.User-Based Licensing:
Tableau’s price model is usually per-user and very flexible. Tableau offers different licenses, such as Viewer, Explorer, and Creator. This makes it possible for organizations to expand the utilization depending on the users and their requirements for the application.
2.Subscription Model:
Tableau works on the subscription model. They provide upgrades and support for their product, and it has an annual subscription manner. This also makes it easier for businesses to control expenditures regarding the usage of this particular media and the recent upgrades.
Conclusion
Adobe Analytics and Tableau are two very useful tools that complement each other in the data analytics and business intelligence industries. All in all, both Adobe Analytics and Tableau have their strengths and weaknesses, and the decision of which to use would depend on the organization’s requirements and/or objectives. If there are real-time web analytics and customer journeys involved then Adobe Analytics is a more suitable option. For businesses that want strong data visualizations and BI features, the best option is Tableau.